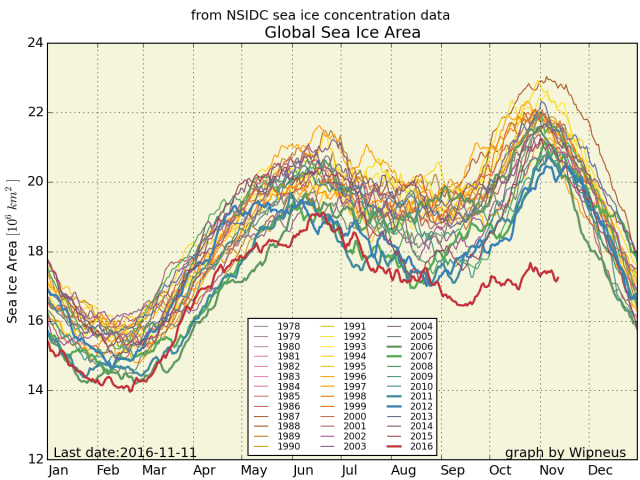
Chart from the National Snow and Ice Data Center. See that red line? that’s area of ice as of this November. See how it’s not going up? That’s really, really bad.
While we ‘Muricans were fighting about the worst election in modern US history, this news came in from the Arctic. You can read past posts I’ve had here about the loss of Arctic ice, but it has always started coming back in October of each year. Not this year. If this is the ‘new November’, what will February look like? We may be trending into runaway warming far faster than anybody has anticipated.
President elect Donald Trump (wow, I hate typing that) has selected Myron Ebell to head the ‘transition team’ for his administration. Myron Ebell is the climate advisor guy for the Competitive Enterprise Institute, and a full-blown denialist. He fits in perfectly with Trump’s stance that Global Warming is a hoax cooked up by the Chinese.
Meanwhile, the GOP has already interfered with critical climate science research–it has cut funding for satellite measurements of the Arctic. You can read about it here. But you cannot hide the ice losses occurring right now by disabling the satellites. We may be down to zero ice come spring 2017, and you won’t need a satellite picture to measure that–you can see the water as it laps up around lower Manhattan. And the only good news is the schadenfreude I will experience when Trump has to fess up that yes, the climate’s out of control.
UPDATE: I may have been misleading insofar as this chart represents the loss of sea ice at BOTH POLES. I did not know that when I first posted. Nonetheless, the shrinkage is huge.
Sorry for the error.
